To debug your custom application pages located in layouts folder, perform the following steps:
- In IIS, select your web application and from context menu, select Open. It will display the directory in windows explorer
- Edit Web.config in any text editor (e.g. Notepad)
- In web.config, search for compilation node like “<compilation batch=”
- To enable debugging, update the node as follows
- Set batch=false
- Set debug=true
- After update, your compilation node will become <!– /* Style Definitions */ p.MsoNormal, li.MsoNormal, div.MsoNormal {mso-style-parent:””; margin:0cm; margin-bottom:.0001pt; mso-pagination:widow-orphan; font-size:12.0pt; font-family:”Times New Roman”; mso-fareast-font-family:”Times New Roman”;} @page Section1 {size:595.3pt 841.9pt; margin:72.0pt 90.0pt 72.0pt 90.0pt; mso-header-margin:35.4pt; mso-footer-margin:35.4pt; mso-paper-source:0;} div.Section1 {page:Section1;} –>
<compilation batch=“false“ debug=“false“>
- Launch Internet Explorer and browse your custom application page
- Now, launch Visual Studio and open your Custom Application Page from layouts directory
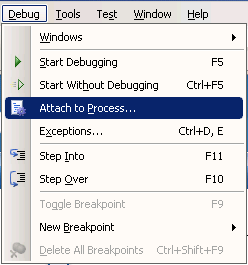
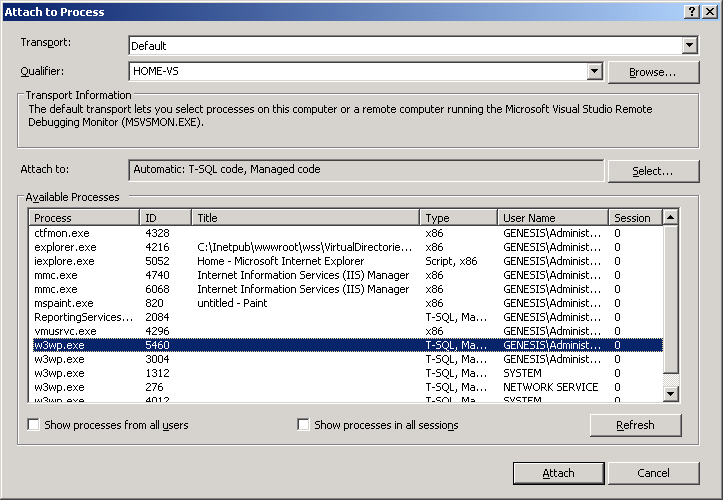
- Go to Debug->Attach To Process and attach to w3wp.exe
- Add break points as necessary.
- In Internet Explorer, refresh your page and bingo! you can debug your custom application page now.


Thanks a lot
Many Many Thank you
Thanks
thanksssssss
Thank you… You are gr8. I am big fan of you. 🙂